Introduction
Getting IPO valuation wrong has real consequences. In FY2023-24, approximately 85 companies allowed their SEBI approvals to lapse or withdrew their offer documents, representing roughly ₹1.2 lakh crore in potential capital — much of it lost to mispricing and unrealistic price expectations.
Most of those failures trace back to one thing: a broken or poorly applied IPO valuation model. This is the analytical framework investment bankers use to determine a private company's fair value range before it lists on a public exchange. Get it right, and the company raises maximum capital with strong institutional demand and a healthy listing pop. Get it wrong, and the consequences range from weak subscription to a forced withdrawal.
This guide is written for Indian founders and CFOs preparing for a Main Board or SME listing — and the bankers advising them. It breaks down how IPO valuation models are actually built, what drives the final pricing decision, and where the process most commonly breaks down.
Key Takeaways
- An IPO valuation model combines multiple methodologies — trading comps, DCF, and precedent transactions — to produce a defensible price range, not a single number.
- Investment banks set a price band before the issue opens, then calibrate the final offer price using real investor demand from book-building.
- Key inputs — financial projections, peer multiples, market conditions, anchor investor feedback — shift throughout the IPO timeline.
- Pricing too high kills demand and pricing too low leaves capital on the table — the model's job is finding the number that clears the book without giving away upside.
- Median listing gains dropped from 15.2% in 2024 to 3.8% in 2025 — overpricing risk is rising, making valuation discipline more critical than ever.
What Is an IPO Valuation Model?
An IPO valuation model is a structured set of financial analyses built by investment bankers to estimate the equity value of a pre-IPO company and establish a defensible price band — one that supports book-building with institutional investors and holds up under real market scrutiny.
The model's goal is specific: arrive at a price band that maximises capital raised for the issuer while generating enough demand from QIBs (Qualified Institutional Buyers), HNIs, and retail investors to achieve full subscription — and ideally a listing gain that builds long-term market credibility.
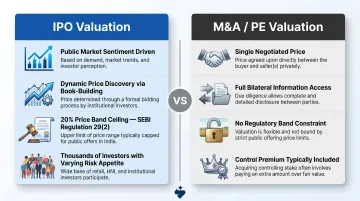
How It Differs from Standard Valuation
An IPO valuation model is not the same as an M&A or private equity valuation. The differences matter:
- M&A valuation targets a single negotiated price between two parties with access to full information
- IPO valuation must account for public market sentiment, peer trading multiples at listing, and thousands of investors with varying information and risk appetite
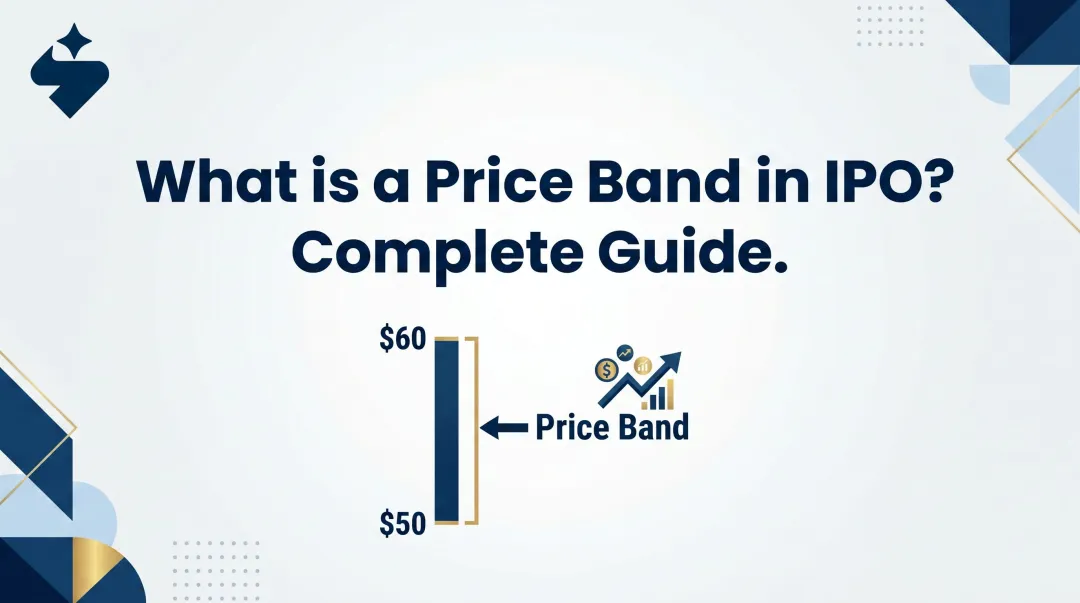
- SEBI ICDR rules constrain the range — Regulation 29(2) mandates that the cap price cannot exceed 120% of the floor price, making the 20% band a hard ceiling
- Price discovery is dynamic — book-building surfaces the final offer price through real-time investor demand, not a number fixed upfront by the model
The model produces a defensible range. Where the final price lands within that range is a market decision — shaped by the demand that book-building reveals.
Core Components of an IPO Valuation Model
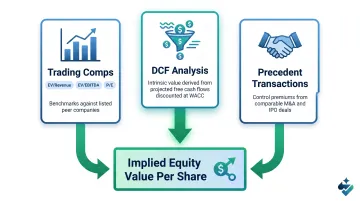
IPO valuation models combine four analytical components, each contributing a different perspective on value.
Comparable Company Analysis (Trading Comps)
This is the most heavily weighted method. Bankers select 5–10 publicly listed peers in the same sector, calculate trading multiples — EV/EBITDA, EV/Revenue, P/E — and apply them to the issuer's projected financials to derive an implied valuation range.
Two details carry the most weight in practice:
- Peer selection quality is decisive. The wrong peer set anchors the valuation to the wrong market — institutional investors will challenge it immediately.
- New issue discount is expected. IPO shares are typically priced at a 10–20% discount to listed peer multiples to compensate investors for new-issue risk and information asymmetry. Academic research on Indian IPOs confirms consistent underpricing of 10% or more — this isn't a flaw in the model; it's a deliberate feature that drives subscription.
For Main Board IPOs, bankers typically use both Indian and global comparables. SME valuations focus on domestic peers given the different investor base and issue size.
Discounted Cash Flow (DCF) Analysis
DCF values the company on its standalone projected free cash flows, discounted back at the weighted average cost of capital (WACC). The output is an intrinsic value — independent of what public markets are currently paying for peers.
In practice, DCF functions as a supportive rather than primary method in most IPO contexts:
- For growth-stage companies with limited earnings history, DCF assumptions are highly sensitive to terminal growth rate and margin expansion projections
- QIBs discount DCF-heavy valuations when assumptions aren't grounded in demonstrated financial performance
- Over-relying on DCF with aggressive assumptions to justify a higher price is one of the most common errors in IPO valuation
Precedent Transaction Analysis
Bankers review historical M&A and IPO transactions in the same sector to understand at what valuation multiples similar companies were acquired or listed. This provides a market-tested reference point.
Transaction multiples carry a control premium — acquirers pay above public market prices for full control of a business. Bankers must strip out this premium when applying precedent transactions to an IPO context, where no control is changing hands.
Sensitivity and Scenario Analysis
Bankers stress-test the valuation across multiple assumptions — revenue growth, margin trajectory, peer multiple contraction, and market conditions — to produce a bull/base/bear range. The price band is drawn from the lower and upper ends of this range.
Under SEBI's regulations, the cap price cannot exceed 120% of the floor price. This constraint directly shapes how the sensitivity range is constructed: the model must produce a credible range that fits within a 20% spread.
How Investment Banks Build and Use an IPO Valuation Model
The model is not built once and frozen. It evolves iteratively from the first internal estimate through to the final pricing meeting.
Step 1: Establish Financial Projections and Peer Universe
Bankers work with management to stress-test 3–5 year revenue, EBITDA, and free cash flow projections, ensuring they are auditable and defensible under investor scrutiny. Simultaneously, they identify 5–10 listed peers, screening for business model similarity, revenue scale, and market cap relevance.
At S45, this peer selection spans both Indian and global comparables for Main Board mandates, with domestic-focused comps for SME issues — recognising that the investor base and valuation reference points differ significantly between the two platforms. Once the peer universe is locked, the actual valuation work begins.
Step 2: Build the Valuation Range Using Multiple Methods
Three methods run in parallel — no single approach is used in isolation:
- Trading comps: Benchmarks the company against listed peers on EV/Revenue, EV/EBITDA, and P/E multiples
- DCF analysis: Derives intrinsic value from projected free cash flows, discounted at a WACC reflecting sector risk
- Precedent transactions: Anchors the range against control premiums paid in comparable deals
The output is an implied equity value per share (pre-money), from which the post-money value after IPO proceeds is derived. A valuation supported by all three methods holds up under institutional scrutiny far better than one driven by a single approach.
Step 3: Set the Price Band and Draft DRHP Disclosures
The floor and cap are derived from the lower and upper ends of the valuation range after applying appropriate discounts. Under Schedule VI of SEBI ICDR Regulations, the basis of issue price must be disclosed in the DRHP — including the valuation methodology used, the peer comparison, and the rationale for any discount applied. This makes the pricing narrative a regulatory document, not just an internal slide.