Introduction
For most Indian founders and investors, IPO pricing feels opaque — decisions appear arbitrary, disconnected from fundamentals, or both. Getting the price wrong is expensive: underpricing leaves capital on the table, while overpricing risks a weak listing and lasting reputational damage.
An IPO share price is not set arbitrarily. It is the outcome of a formal valuation process that converts a company's estimated worth into a per-share price, shaped by both rigorous financial analysis and live market demand during the bookbuilding window.
This article breaks down the valuation methods investment bankers use, the pricing process from DRHP filing to listing, and the factors that move the final price band — so you know exactly what drives the number before the subscription window opens.
Key Takeaways
- IPO share price = estimated company valuation ÷ total shares issued at listing
- Investment bankers use multiple valuation methods: comparable company analysis, DCF, precedent transactions, and asset-based approaches
- SEBI requires a price band (floor and cap within 20% spread) for book-built IPOs, with final price set through QIB, NII, and retail bids
- Final price reflects market demand, growth narrative, sector comparables, and macroeconomic timing alongside financials
- Issue price and listing price differ — the gap reveals how accurately the IPO was priced against actual market demand
What Is IPO Share Price Determination?
IPO share price determination is the process by which a company's equity value is divided by the total shares on offer to arrive at a per-share price. That per-share price is then expressed as a price band — the range within which investors place bids during the subscription window.
Unlike secondary market pricing — where share prices update continuously through live orders on NSE and BSE — IPO pricing is a pre-listing exercise. It happens privately between the company, its SEBI-registered merchant banker, and institutional investors before any public trading begins.
Two Primary Pricing Mechanisms in India
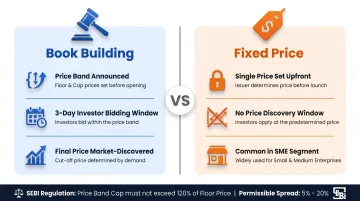
India uses two primary mechanisms under SEBI's ICDR Regulations, 2018:
Book Building (dominant method):
- The company announces a price band (e.g., ₹180–₹200 per share)
- Investors bid within this band during a 3-day subscription window
- The final issue price is discovered based on actual demand
Fixed Price:
- The company sets a specific price upfront in consultation with the lead manager
- No price discovery during the subscription window
- More common in the SME segment
Critical SEBI regulation: Regulation 30(4) mandates that the price band cap cannot exceed 120% of the floor price. For example, if the floor price is ₹100, the cap cannot exceed ₹120. The minimum spread is 5%, and the maximum is 20%.
The Core Valuation Methods Used to Price an IPO
No single method determines an IPO price. Experienced investment bankers triangulate across multiple approaches and apply judgment based on sector dynamics, the company's growth stage, and current market conditions. The final valuation range is a negotiated consensus between the company and its bankers, not a single mechanical output.
Comparable Company Analysis (CCA)
Bankers identify publicly listed peers in the same sector and analyse valuation multiples — EV/EBITDA, P/E, Price-to-Sales — to estimate what the market is willing to pay for a rupee of earnings or revenue in that sector.
Example: Hyundai Motor India IPO (October 2024)
The Hyundai DRHP included a detailed peer comparison table for FY24:
| Company | EPS (Basic) | P/E Ratio | Total Income (₹ Cr) | RoNW (%) | NAV |
|---|---|---|---|---|---|
| Hyundai Motor India | 74.58 | 26.28 | 69,829 | 56.82 | 131.26 |
| Maruti Suzuki India | 429.01 | 29.38 | 1,41,858 | 15.75 | 2,723.77 |
| Tata Motors | 81.96 | 11.36 | 4,37,928 | 36.98 | 221.67 |
| Mahindra & Mahindra | 101.14 | 29.96 | 1,38,279 | 17.02 | 594.08 |
Hyundai's IPO was priced at ₹1,865–₹1,960 per share (P/E of 26.28x at upper band), while the peer average P/E was approximately 19.97x. Analysts described the IPO as "fully priced" relative to peers, reflecting strong demand for the automotive sector leader.
Sector-specific multiples vary widely. According to Moneycontrol's sector analysis (accessed May 2026), Indian sector P/E ratios include:
- Banks: 17.06x
- Automobile & Ancillaries: 24.47x
- Software & IT Services: 37.99x
- Healthcare: 85.08x
- Capital Goods: 175.27x
A company priced above its sector average multiple needs a clear growth story to justify the premium — otherwise institutional investors will push back during bookbuilding.
Discounted Cash Flow (DCF) Method
Analysts project the company's future free cash flows (typically 5-10 years) and discount them back to present value using a risk-adjusted discount rate (WACC — weighted average cost of capital).
DCF is heavily dependent on the quality of financial projections. It works well for companies with stable, predictable revenues. For early-stage businesses, it carries less weight.
DCF is most reliable when:
- Revenue is stable and recurring (manufacturing, infrastructure, mature financial services)
- The company has at least 3 years of audited operating history
- Cash flow margins are consistent, not lumpy
For businesses with volatile cash flows or limited operating history, bankers assign DCF a lower weight in the valuation mix and lean more heavily on comparable multiples.
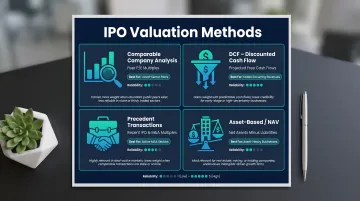
Precedent Transactions Analysis
Bankers study valuation multiples from recent IPOs and M&A deals in the same sector to establish a market-tested benchmark. If recent IPOs in fintech achieved 8-10x revenue multiples, this sets expectations for new fintech issuers.
India's listing activity gives bankers a rich reference pool. According to DLA Piper's May 2025 report, 327 IPOs listed in 2024 — 93 on Main Board, 247 on SME — raising approximately USD 19.9 billion. Each of those transactions adds a sector-specific data point that directly informs how the next issuer in that space gets priced.
Asset-Based Approach (Net Asset Value)
Used primarily for asset-heavy businesses — real estate, manufacturing, infrastructure, NBFCs — where the company's value is calculated from its net assets minus liabilities.
This approach is more appropriate than earnings-based methods when:
- Physical or financial assets make up the majority of business value
- Earnings are volatile or not yet stabilized
- The company holds significant tangible assets (land, equipment, loan books)
SEBI requires disclosure of Net Asset Value (NAV) per share in every DRHP's "Basis for Issue Price" section, but does not mandate a specific valuation methodology. The NAV approach is market practice, not regulatory requirement.
How the IPO Pricing Process Works — Step by Step
The IPO pricing journey typically takes 6-12 months for Main Board IPOs and 2-3 months for SME IPOs, depending on audit readiness, SEBI observations, and market conditions. The process involves multiple stakeholders: the company, its SEBI-registered merchant banker (in S45's case, Narnolia as Category-I Lead Manager), auditors, legal counsel, and institutional investors.
Step 1: Company Valuation and DRHP Filing
The merchant banker conducts thorough due diligence and valuation using the methods described above. This produces an initial valuation range, which is translated into a price band disclosed in the Draft Red Herring Prospectus (DRHP). DRHP drafting typically takes 30-45 days from a clean data room. The price band may be finalized only in the Red Herring Prospectus (RHP) after SEBI issues its observations — usually within 30 days of filing.
Accurate, well-documented financials are non-negotiable at this stage. Three years of audited financials are mandatory for Main Board IPOs under SEBI ICDR Regulation 6(1). Gaps in disclosure, governance, or financial controls can delay the DRHP filing or force a lower price band.
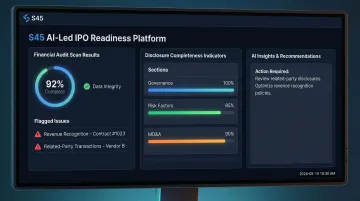
S45's AI-led readiness scans identify these issues before the DRHP is drafted — checking revenue recognition policies, related-party transactions, working capital cycles, and disclosure completeness. Each financial claim in the DRHP is linked to verifiable source documentation, which reduces the risk of SEBI queries and post-listing disputes.
Step 2: Roadshow and Demand Discovery
Before the IPO opens, the company and its bankers conduct roadshows — meetings with Qualified Institutional Buyers (QIBs), mutual funds, insurance companies, AIFs, and other long-only funds. The goal is to gauge demand at different price points within the band.
This pre-IPO demand intelligence is what anchors the price band. Bankers who can map institutional appetite in real time — as S45 does through its proprietary bookbuilding analytics — set the price with more confidence and fewer last-minute revisions.
During this phase, institutional investors provide confidential feedback on:
- Valuation expectations relative to sector comparables
- Concerns about financial disclosures or business risks
- Appetite at the floor, mid, and cap price levels
Anchor investors are approached separately, with detailed information memoranda prepared under SEBI PIT (Prohibition of Insider Trading) regulations. Up to 60% of the QIB portion may be allocated to anchor investors, who commit capital before the public subscription window opens.
Step 3: Bookbuilding and Final Price Discovery
Those anchor commitments set the floor for institutional confidence. The IPO then opens for a 3-day subscription window (extendable by 3 days if the price band is revised), during which three investor categories place bids:
Allocation norms for Main Board IPOs (profitability route under SEBI ICDR Regulation 32):
| Category | Allocation |
|---|---|
| Qualified Institutional Buyers (QIBs) | Not more than 50% |
| Non-Institutional Investors (NIIs) | Not less than 15% |
| Retail Individual Investors | Not less than 35% |
For IPOs via the QIB/non-profitability route (Regulation 6(2)), the structure shifts to favour institutions: QIBs get at least 75%, while retail allocation drops to 10%.
The cutoff price — the final issue price — is set at the level where total bids meet or exceed shares on offer. If the issue is oversubscribed at the upper band, the cutoff price is typically set at the cap. If demand is weak, the price may be set at the floor or the issue may be withdrawn.
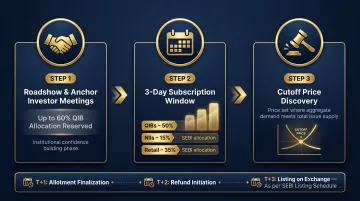
According to SEBI's T+3 circular (mandatory since December 2023), allotment is finalized on T+1, shares are credited on T+2, and listing occurs on T+3 (where T = issue close date).
Key Factors That Influence the Final IPO Share Price
Market Demand and Timing
Two companies with identical financials can receive very different valuations depending on when they list. A bull market with high sector tailwinds will push the price band higher, while weak market sentiment compresses multiples.
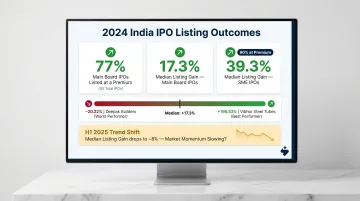
Data point: In 2024, 93 Main Board IPOs listed in India, with 72 (77%) listing at a premium. Median listing gain was 17.3%. By contrast, in H1 2025, median listing gains for Main Board IPOs dropped to approximately 8%, reflecting cooler market sentiment.
The range of outcomes is wide: in 2024, the top performer (Vibhor Steel Tubes) listed at +195.53%, while the worst (Deepak Builders) listed at -20.22%. This volatility underscores the importance of timing and market conditions in IPO pricing.
Industry Comparables and Sector Premium
Sectors currently in favor with institutional investors command higher valuation multiples. If listed peers are trading at elevated P/E or EV/EBITDA ratios, the IPO price band will reflect those elevated benchmarks.
Example: As of May 2026, Capital Goods sector P/E stood at 175.27x, while Banks averaged 17.06x. A capital goods IPO would be benchmarked against the higher multiple, while a banking IPO would face more conservative pricing expectations.
This makes peer selection by the banker a significant lever in pricing. Choosing the right comparables — by geography, scale, product mix, and growth profile — directly influences the achievable valuation range.
Growth Narrative and Quality of Financials
Companies with consistent revenue growth, strong EBITDA margins, and a credible expansion story attract higher valuation multiples. The narrative matters — but it must be anchored in financials that hold up under institutional scrutiny.
SEBI's disclosure requirements vary by route:
- Main Board (profitability route, Regulation 6(1)): Minimum ₹3 crore net tangible assets in each of the preceding 3 years; average pre-tax operating profit of ₹15 crore during 3 of the preceding 5 years
- SME (Regulation 229): Post-issue paid-up capital cannot exceed ₹25 crore; NSE Emerge requires minimum ₹3 crore post-issue capital and operating profit of ₹1 crore for 2 out of 3 years
The quality and presentation of financials in the DRHP directly affect investor confidence and the achievable price.
Clean audit reports, transparent disclosure of related-party transactions, and evidence-linked financial narratives build trust with QIBs — and that trust is what supports pricing at the upper end of the band.
Company-Specific Qualitative Factors
Management credibility, sector positioning, promoter background, IP or technology moats, and the use of IPO proceeds all influence how institutional investors perceive the issue.
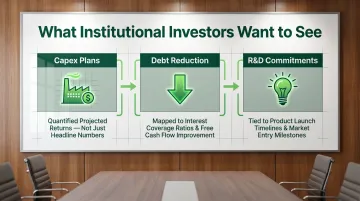
A clearly articulated use-of-funds story drives institutional demand at the upper end of the price band. Investors respond to specifics:
- Capex plans with quantified projected returns, not just headline numbers
- Debt reduction mapped to improved interest coverage ratios and free cash flow
- R&D commitments tied to concrete product launch timelines or market entry milestones
During roadshows, S45 works with issuers to prepare management teams for institutional meetings, ensuring that qualitative factors — governance structures, board independence, strategic vision — are presented with clarity and confidence.
Common Misconceptions About IPO Pricing
Misconception: "A higher IPO price means the company is more valuable"
Reality: The IPO price per share is a function of how many shares have been issued, not just the company's absolute value.
A company with a lower per-share price (e.g., ₹50) but 100 crore shares outstanding has a market capitalization of ₹5,000 crore. Another company with a higher per-share price (e.g., ₹500) but only 5 crore shares outstanding has a market cap of just ₹2,500 crore. The first company is twice as valuable despite the lower per-share price.
What matters: Market capitalization (share price × total shares outstanding), not the per-share price in isolation.
Misconception: "IPO price and listing price are the same"
Reality: The issue price is the price at which allottees receive shares. The listing price is the price at which the share first trades on NSE/BSE on listing day.
The gap — called the listing pop — reflects whether the IPO was priced conservatively relative to actual market appetite, or whether it was overpriced.
In 2024, 222 of 247 SME IPOs (90%) listed at a premium, with a median listing gain of 39.3%. Main Board IPOs saw a median listing gain of 17.3%. These pops indicate that most issues were priced conservatively, leaving some upside for allottees.
Grey Market Premium (GMP) is often cited as a predictor of listing price — it's the price at which grey market traders buy and sell IPO shares before listing day.
In practice, GMP is unregulated and speculative, frequently driven by hype rather than fundamentals. In 2025, 28 of approximately 50 listed firms delivered muted listings despite elevated GMP signals — a reminder that grey market buzz and actual market demand are different things.
Misconception: "IPO pricing is purely a financial calculation"
Reality: Narrative, timing, and investor sentiment play as large a role as the numbers.
Companies that go public during high-demand market windows often achieve valuations that pure DCF analysis alone would not support. The reverse is also true: strong fundamentals don't protect a company from a weak listing if timing is off or investor communication is unclear.
During bookbuilding, bankers run pre-IPO soundings with anchor investors to test pricing before the issue opens, then adjust the band in real time as subscription data comes in. The models set the range. The market decides where within it the price lands.
What matters: A defensible price band requires both the financial model and a read on live investor appetite — neither alone is sufficient.
Frequently Asked Questions
How is share price determined at IPO?
The IPO share price is derived by dividing the company's total estimated valuation (arrived at through comparable analysis, DCF, and precedent transactions) by the total number of shares being issued. This per-share price is then presented as a price band for investor bidding during the bookbuilding window.
Who decides the share price in an IPO?
The company and its SEBI-registered merchant banker jointly determine the price band, informed by due diligence, investor roadshows, and comparable valuations. The final issue price within that band is decided by market demand during the bookbuilding window, based on actual bids received from QIBs, NIIs, and retail investors.
What is the pricing method of an IPO?
India uses two methods under SEBI ICDR Regulations: book building (where a price band is announced and the final price is market-discovered through investor bids) and fixed price (where the company sets a specific price upfront). Book building is the standard for most Main Board IPOs and the majority of SME IPOs.
How to predict IPO listing price?
The listing price cannot be predicted with certainty. Indicators like subscription rates (especially QIB and NII portions), grey market premium (GMP), and broader market sentiment on listing day give a directional estimate. Strong oversubscription at the upper end of the price band typically signals a positive listing, but GMP is speculative and not always reliable.
What is a pre-IPO valuation?
A pre-IPO valuation is the estimated enterprise value of the company before the IPO is priced, established during the DRHP preparation stage. It forms the basis for the price band and is typically set below the IPO valuation — giving investors a perceived entry advantage and accounting for the risk of subscribing to an unlisted security.
What are the types of IPO?
In India, IPOs are classified along two dimensions:
- Listing platform: Main Board (NSE/BSE) or SME exchange (BSE SME, NSE Emerge)
- Offer structure: Fresh issue (new shares; company receives proceeds) or offer for sale (existing shareholders exit; proceeds bypass the company)
Both structures can use either book building or fixed price methods.
IPO pricing is not a single calculation — it's a process that moves from financial modeling and sector benchmarking through regulatory filings to live investor demand. Founders who understand each stage enter the market better prepared. Investors who track the signals — subscription rates, QIB demand, grey market movement — make sharper decisions on listing day.