Introduction
DCF analysis sits at the centre of IPO valuation in India. Investment bankers, SEBI-registered valuers, and institutional investors all reference it when anchoring a company's issue price — and with 103 Main Board IPOs raising ₹1,75,901 crore in CY2025 alongside 267 SME IPOs, a weak DCF methodology in your DRHP exposes you to SEBI queries, anchor investor pushback, and a price band that the market simply rejects.
Yet many founders approach their IPO with strong fundamentals and no real understanding of how DCF produces a valuation number. The result: mispriced issues, weak anchor investor conversations, and DRHP disclosures that don't hold up under scrutiny.
This guide breaks down exactly how DCF analysis works in the Indian IPO context — from forecasting free cash flows to arriving at an issue price band. This is how it works as a live valuation tool in actual DRHP preparation, not a textbook walkthrough.
Key Takeaways
- DCF estimates intrinsic value by discounting projected future free cash flows at a risk-adjusted rate (WACC)
- Indian DRHPs typically present DCF alongside comparable company multiples and precedent transaction analysis
- Anchor the risk-free rate to RBI's 10-year G-sec yield; cap terminal growth at India's long-run nominal GDP growth rate
- Small changes in WACC or terminal growth rate can shift the derived equity value materially
- DCF is most reliable for companies with 3–5 years of operating history and predictable, recurring cash flows
What Is DCF Analysis and Why It Matters for IPOs
DCF — Discounted Cash Flow — estimates what a business is worth today based on the cash flows it is expected to generate in the future, adjusted for the time value of money and investment risk.
That distinguishes it from market-based methods like P/E or EV/EBITDA multiples, which rely on peer comparisons. DCF is internally derived. It forces the company to commit to specific financial assumptions that can be audited, challenged, and defended.
Why DCF Exists in the IPO Context
Public market investors subscribing to an IPO ask one fundamental question: is this company worth the price being asked? DCF answers it from first principles — not by pointing at a sector peer, but by working through the company's own projected cash flows.
For issuers and their bankers, that matters because SEBI's ICDR Regulations require disclosure of the basis of issue price under Schedule VI. The DCF analysis, where used, must be supportable — not aspirational.
What DCF Is Not
That supportability requirement is precisely where DCF draws the most SEBI scrutiny. Before getting into the mechanics, three boundaries matter:
- It is not a pricing guarantee or a price set by SEBI
- It does not replace bookbuilding price discovery
- It is not the only valuation method required in a DRHP
Those boundaries matter because SEBI reviewers will test every assumption in the model — growth rates, discount rates, terminal value — against the disclosures elsewhere in the DRHP.
How DCF Analysis Works for IPOs: Step-by-Step
DCF analysis in an IPO context follows a defined sequence. Each stage builds on the previous, and the final output is an estimated equity value per share that informs the IPO price band.
Stage 1: Forecasting Free Cash Flows
The starting point is projecting the company's Free Cash Flow to the Firm (FCFF) for a defined forecast period — typically five years.
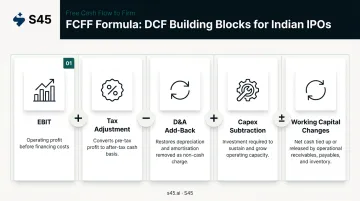
Per ICAI Valuation Standard 301, the FCFF formula is:
FCFF = EBIT × (1 − Tax Rate) + Depreciation & Amortisation − Capital Expenditure − Increase in Non-Cash Working Capital
Each component serves a specific purpose:
- EBIT represents operating profit before financing costs
- Tax adjustment converts pre-tax profit to an after-tax figure
- D&A add-back restores the non-cash charge that reduced EBIT
- Capex subtraction captures investment required to sustain and grow operations
- Working capital changes reflect the cash tied up in running the business
For IPO purposes, these projections must be rooted in 3–5 years of audited historical financials. Assumptions for revenue growth, operating margin trajectory, and capex requirements must be explicitly stated and defensible. SEBI raises observations on projections it views as unsupported, and institutional investors will pressure-test assumptions during the roadshow — aggressive inputs get questioned before allocation decisions are made.
With the cash flow projections set, the next step is determining the rate at which to discount them back to today.
Stage 2: Calculating WACC
WACC is the blended required return across the company's capital structure — what equity holders and debt holders each demand, weighted by how much of each sits on the balance sheet.
WACC = (Equity Weight × Cost of Equity) + (Debt Weight × Cost of Debt × (1 − Tax Rate))
The Cost of Equity is derived from CAPM:
Cost of Equity = Risk-Free Rate + Beta × Equity Risk Premium
India-specific inputs for 2025–2026:
| Input | Reference Value | Source |
|---|---|---|
| Risk-Free Rate | ~6.31% (10-year G-sec, June 2025) | Secondary market tracker; verify from FBIL/RBI before use |
| Total Equity Risk Premium | 7.08% | Damodaran, January 2026 |
| Country Risk Premium | 2.85% | Damodaran, January 2026 |
| Corporate Tax Rate | 22% (Section 115BAA) or 25%/30% + surcharge + 4% cess | Income Tax Department |
Beta for a pre-IPO company is estimated from listed comparable companies — unlever using peer debt/equity ratios and relever for the subject company's capital structure.
Stage 3: Computing Terminal Value
Businesses are expected to continue beyond the five-year forecast window. DCF captures that continuing value through the terminal value, calculated using one of two methods:
Gordon Growth Model (Perpetuity Method): Terminal Value = Final Year FCFF × (1 + g) / (WACC − g)
where g is the long-run terminal growth rate.
Exit Multiple Method: A relevant market multiple (e.g., EV/EBITDA) is applied to the terminal year metric.
For Indian companies, the terminal growth rate is benchmarked to long-run nominal GDP growth — broadly, real GDP growth plus inflation. With RBI projecting FY2025-26 real GDP at 6.8% and CPI at 2.6%, a terminal growth rate in the range of 4–6% is defensible depending on sector maturity. Pushing the terminal growth rate above long-run nominal GDP implies the company will eventually outgrow the entire economy — SEBI valuers and QIB analysts will challenge that assumption directly.
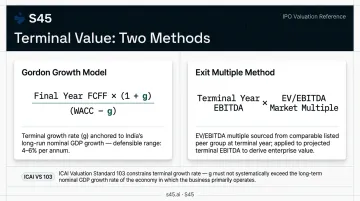
ICAI Valuation Standard 103 is explicit: terminal growth should generally not exceed the long-run average growth rate for the products, industries, or country in which the entity operates.
Stage 4: Discounting to Enterprise Value
Each year's projected FCFF and the terminal value are discounted to present value using:
Discount Factor = 1 / (1 + WACC)^t
The sum of all discounted cash flows plus the present value of terminal value gives Enterprise Value (EV).
From EV:
- Subtract net debt (total debt minus cash)
- Add non-operating assets
- Divide by fully diluted shares
The result is an intrinsic value per share — the anchor for the IPO price band conversation.
Key Inputs That Drive DCF Valuation in Indian IPOs
Revenue Growth Assumptions
Revenue growth is the most visible and challenged input in any DRHP. These projections must be grounded in:
- Historical company CAGR over 3–5 audited years
- Sector-level research and addressable market data
- Management plans tied to specific capex or product expansion milestones
Aspirational numbers without operational justification create credibility problems with both SEBI (which requires KPI disclosures under the 2025 circular SEBI/HO/CFD/CFD-PoD-2/P/CIR/2025/28) and institutional investors during roadshows.
Operating Margin Trajectory
The model must reflect not just revenue growth but how margins evolve over the forecast period. For Indian SMEs and mid-caps, this typically requires explaining:
- Operational leverage as fixed costs are spread over higher revenues
- Raw material cost normalisation
- Planned efficiency gains from capex
Margin assumptions interact directly with capex and working capital projections. An integrated financial model surfaces these interdependencies; a siloed one creates inconsistencies that are hard to defend.
WACC Sensitivity
A 1–2 percentage point change in WACC can meaningfully shift equity value. Several factors push WACC higher for Indian companies:
- Smaller size increases the risk premium applied
- Higher Beta in cyclical or early-stage sectors
- Leverage amplifies the cost of equity through the relevering calculation
Bankers build sensitivity tables showing equity value across a range of WACC scenarios — typically ±1% and ±2% around the base case. This range, not a single point estimate, is what informs where the price band is anchored.
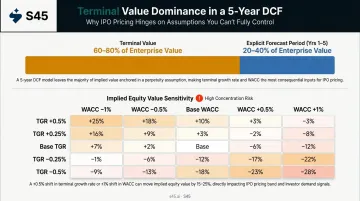
Terminal Value Weight
In a typical five-year DCF, terminal value can represent 60–80% of total enterprise value. That concentration makes the terminal growth rate assumption especially consequential in an IPO context.
A defensible, inflation-anchored terminal growth rate withstands scrutiny. A rate implying the business grows faster than the Indian economy indefinitely is difficult to defend and undermines the credibility of the entire model.
Placing DCF in Context
Because terminal value carries so much weight, DCF outputs alone rarely anchor a price band. For IPO pricing, the DCF-derived valuation is placed alongside comparable company trading multiples and sector transaction precedents.
S45's pricing and demand strategy work — which includes India and global comparable company analysis, pilot-fishing exercises, and anchor investor education — stress-tests DCF outputs against real-time demand signals before bookbuilding begins. When fundamentals and live market intelligence align, the price band narrows from a range to a number the book can actually support.
Where DCF Fits in the Indian IPO Process
DRHP Disclosure
DCF appears formally in the DRHP under the valuation section, where the company justifies its issue price per Schedule VI of the SEBI ICDR Regulations. The investment banker or registered valuer prepares the analysis, typically alongside two or three other methodologies.
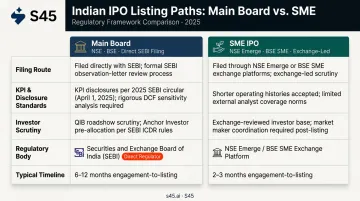
Main Board vs. SME disclosure paths differ:
- Main Board DRHPs are filed with SEBI directly and receive formal observation-letter review. The basis-of-issue-price section is subject to SEBI scrutiny, and KPI disclosures (per the 2025 circular applicable to draft offer documents filed from April 1, 2025) must align with valuation claims.
- SME IPO documents go through exchange platforms (NSE Emerge, BSE SME), with scrutiny led by the respective exchange rather than SEBI directly.
Setting the Price Band
The investment banker uses the DCF-derived equity value per share as an anchor, then adjusts for market conditions, sector sentiment, and expected anchor investor demand.
A DCF suggesting fair value of ₹200–230 per share gives the banker a rationale for a band of ₹190–220. The band isn't arbitrary; it's anchored in the DCF output and stress-tested against fundamentals. That discipline matters particularly for anchor allocation, which takes place one working day before issue opening.
Investor Roadshows
Once the band is set, roadshows put the DCF assumptions directly in front of QIBs — revenue growth, margin trajectory, WACC. A well-constructed model with auditable assumptions builds credibility; a poorly prepared one invites aggressive bidding below the band or weak anchor demand.
The scrutiny level differs by listing path:
- SME listings face a harder task supporting DCF assumptions with third-party benchmarks, given shorter operating histories and limited external analyst coverage.
- Main Board listings require more rigorous sensitivity analysis and closer alignment between DCF assumptions and the operating plan disclosed elsewhere in the DRHP.
Limitations of DCF for Indian IPO Valuations
DCF is a powerful framework. It is also sensitive to assumptions that are genuinely difficult to make reliably.
Forecast reliability: DCF is only as credible as its inputs. For companies in early growth phases or high-cyclicality sectors — EV, clean energy, consumer tech — projecting free cash flows five years out requires assumptions that may not hold. This is why SEBI and institutional investors treat DCF as one data point, not a definitive answer.
Terminal value concentration: When 60–80% of enterprise value sits in the terminal value, a modest shift in the terminal growth rate or WACC moves the derived IPO price band materially. Raising the terminal growth rate by 0.5% while reducing WACC by 1% can inflate the implied valuation by 15–25% — which is exactly the sensitivity that institutional investors model in parallel during their own diligence.
DCF also cannot capture market timing, sector sentiment, or IPO demand dynamics. A company may have a sound DCF-justified valuation and still face weak subscription if conditions shift between DRHP filing and listing. The record shows this risk is real — six IPOs including Paytm and DreamFolks traded more than 50% below issue prices, with analysts citing overvaluation and unrealistic growth expectations.
That gap — between a defensible DCF and what the market will actually bear on listing day — is where pricing discipline and live demand intelligence matter most.
Conclusion
DCF, done properly, is a structured test of a company's financial logic. When built on clean historical data, supportable growth assumptions, and India-appropriate discount rate inputs, it produces a valuation that holds up under scrutiny from SEBI, institutional investors, and anchor participants.
Founders who understand how their company's cash flows translate into an enterprise value arrive at banker and investor conversations with a different quality of preparation. They can defend their price band, explain their margin trajectory, and respond to WACC challenges with confidence.
That preparation doesn't happen in the week before filing. For founders preparing for a Main Board or SME listing, S45's DRHP-ready process is built to surface these numbers early, so that valuation becomes a strength in the process rather than a gap that shows up under investor questioning.
Frequently Asked Questions
What does a DCF analysis tell you?
A DCF analysis tells you what a business is intrinsically worth today, based on the cash flows it is expected to generate in the future, adjusted for the time value of money and investment risk. In an IPO context, it tells you whether the issue price is above, below, or in line with that intrinsic value.
What is the 3-stage DCF model?
A 3-stage DCF separates the forecast horizon into a high-growth period, a transition/tapering period, and a stable terminal phase, each carrying different growth rate assumptions. It is most relevant for high-growth IPO-stage companies where growth is expected to decelerate meaningfully rather than hold constant.
How is WACC determined for an Indian company before its IPO?
WACC combines the Cost of Equity (CAPM-derived, using the RBI 10-year G-sec yield as the risk-free rate) and the after-tax Cost of Debt, weighted by target capital structure. Since unlisted companies have no observable Beta, bankers use a peer-average from comparable listed companies and adjust for size and leverage.
What terminal growth rate is used in Indian IPO valuations?
The terminal growth rate is benchmarked to India's long-run nominal GDP growth, meaning real GDP growth plus inflation. Based on current RBI projections, 4–6% is the defensible range depending on sector maturity. Anything above nominal GDP growth will likely draw scrutiny from SEBI reviewers and institutional investors.
Is DCF the only valuation method used in Indian DRHP filings?
No. SEBI does not prescribe a single valuation method. Most DRHPs include DCF analysis, comparable company trading multiples (P/E, EV/EBITDA), and sometimes precedent transaction analysis. DCF typically serves as the intrinsic value anchor; multiples provide market context. The issue price is justified by reference to all methods together.
What are the most common DCF mistakes founders make during IPO preparation?
Three errors consistently damage credibility with institutional investors and SEBI: overstating revenue growth without clear operational justification, using a WACC that underestimates actual business risk (especially for smaller or less liquid companies), and setting the terminal growth rate too high relative to sector and macroeconomic norms.