
Introduction
A DCF model produces one number. Investors don't trust one number.
That's the fundamental tension every founder faces when walking into a fundraising conversation or preparing for an IPO. Valuation is built on assumptions — about growth, about risk, about how long the good times last — and every serious investor will stress-test those assumptions the moment you present them.
Sensitivity analysis is how you get ahead of that conversation. It transforms a single enterprise value into a credible range, showing exactly how valuation moves when key inputs shift. For founders preparing for a capital raise, an IPO, or M&A, understanding this tool isn't optional — it's the difference between pricing with discipline and getting negotiated into a corner.
The CFA Institute's free cash flow valuation curriculum treats sensitivity analysis as an explicit requirement of professional DCF practice — one that serious analysts build in from the start, not the end.
What follows covers the core mechanics: which variables move the needle most, how to build a two-variable data table, and what the output looks like for an Indian mid-market business preparing to price an issue.
Key Takeaways
- Sensitivity analysis tests how changes in WACC and terminal growth rate affect enterprise value — small shifts can cause large valuation swings.
- Terminal value typically accounts for ~75% of total DCF value, making it the most sensitive component to stress-test.
- A two-variable data table is the standard tool — WACC on one axis, terminal growth rate on the other, enterprise value at each intersection.
- Presenting a valuation range rather than a single number signals analytical discipline and holds up better under investor scrutiny during book-building.
What Is Sensitivity Analysis in a DCF Model — And Why It Matters
Sensitivity analysis in a DCF context means systematically varying one or two key input assumptions and observing how enterprise value (or equity value) changes across those scenarios. You're stress-testing the model you already have, not building a new one.
Why does it matter? Because a DCF is only as credible as its assumptions, and the two most consequential assumptions — discount rate and terminal growth rate — are inherently uncertain. A sensitivity table makes that uncertainty visible, which actually strengthens your valuation's credibility rather than undermining it.
Sensitivity Analysis vs. Scenario Analysis
These two techniques are often confused, but they serve different purposes:
- Sensitivity analysis isolates one or two variables to measure their individual impact on valuation — the output is typically a heat-map table
- Scenario analysis changes a full set of assumptions simultaneously to model a specific situation — a recession case, a margin compression case, a bull market case
- How they work together: sensitivity analysis answers "what if WACC moves by 1%?" while scenario analysis answers "what if growth slows and margins compress at the same time?" Run both for a complete picture.
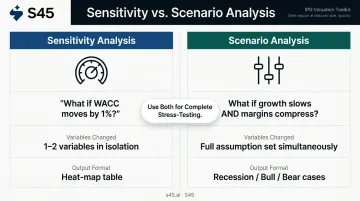
The two techniques are complementary. Using only one leaves gaps in your stress-testing.
Where It Gets Used
Sensitivity analysis appears across several high-stakes contexts relevant to Indian founders and mid-market businesses:
- Investor presentations and pitch decks for fundraising rounds
- IPO Readiness assessments and pre-filing valuation work
- Internal capital allocation decisions
- M&A due diligence, on both buy-side and sell-side
SEBI's basis-for-issue-price framework focuses on accounting ratios, KPIs, peer comparisons, and past transaction valuations — it does not mandate DCF sensitivity tables in DRHPs.
That said, a well-constructed sensitivity analysis remains a powerful internal and investor-facing credibility tool. According to a Prime Database report, average IPO listing gains have fallen from 30% to 8–10% in recent years. In that environment, pricing discipline matters — and sensitivity analysis is one of the clearest ways to demonstrate it.
Key Variables Tested in a DCF Sensitivity Analysis
Not every assumption deserves a sensitivity table. The goal is to identify the two or three variables that most dramatically move enterprise value, then focus your analysis there.
Discount Rate (WACC)
WACC is typically the most influential variable in any DCF. It controls how aggressively future cash flows are discounted — a higher WACC compresses value, a lower WACC expands it.
Even a 0.5% change in WACC can shift enterprise value by 10% or more. To illustrate: a company with ₹500 Cr in stabilised free cash flows, a 12% WACC, and a 5% terminal growth rate might produce an enterprise value of approximately ₹4,500 Cr. Drop WACC to 11.5% and that same model yields ₹5,000+ Cr.
These are illustrative figures; your actual model will reflect your specific cash flow profile.
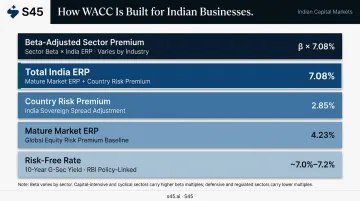
For Indian businesses, WACC sensitivity is particularly pronounced because:
- India's total equity risk premium is 7.08% (Damodaran, January 2026), with a 2.85% country risk premium added to the mature market ERP of 4.23%
- The Indian risk-free rate is anchored to 10-year G-Sec yields, which shift with RBI monetary policy
- Beta assumptions vary significantly across sectors, especially for pre-IPO companies without listed comparables
Terminal Growth Rate
Terminal value typically contributes around three-quarters of total DCF implied valuation in high-growth businesses. That concentration makes the terminal growth rate disproportionately powerful — and disproportionately dangerous if set carelessly.
One critical constraint: Damodaran notes that stable growth cannot exceed the long-run growth rate of the economy. For India, this means terminal growth assumptions should be anchored to long-run nominal GDP growth or the risk-free rate, not the company's current near-term trajectory. Assuming a 9–10% perpetuity growth rate for an Indian business isn't just aggressive — it's logically inconsistent.
That constraint also exposes a common modelling error: raising the terminal growth rate without adjusting reinvestment assumptions (capex, working capital) artificially inflates valuation. The more rigorous approach — the value driver method — ties terminal growth to reinvestment rate and return on invested capital (ROIC): reinvestment rate = expected growth ÷ ROIC. This ensures growth is funded by real capital, not just mathematical assumptions.
Other Variables Worth Testing
Depending on the business, additional variables merit sensitivity testing:
- Revenue growth rate — particularly scrutinised for pre-IPO and early-stage companies where growth is the primary value driver
- EBITDA margin — relevant for businesses in margin expansion stories or sector roll-ups
- Capex intensity — material for asset-heavy businesses in manufacturing, energy, or infrastructure
For IPO-bound businesses, revenue growth rate sensitivity often draws the most attention from institutional investors during due diligence.
How to Run a DCF Sensitivity Analysis — Step by Step
This section is for founders and CFOs who have a working DCF model and want to add rigorous scenario testing.
Step 1 — Build and Validate the Base Case DCF
Before you sensitise anything, confirm the base model is complete and correct:
- Projected free cash flows across the explicit forecast period
- A calculated WACC reflecting your capital structure, cost of equity, and cost of debt
- A terminal value (using either the Gordon Growth Model or exit multiple method)
- A resulting enterprise value that you can defend
Sensitivity analysis is only as reliable as the base model. Before moving to Step 2, verify that your midpoint output matches your standalone DCF calculation — if it doesn't, the table will compound the error across every cell.
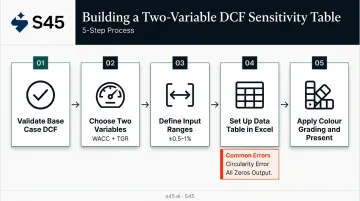
Step 2 — Choose Your Two Variables
Select the two assumptions with the highest impact on enterprise value. In most DCF models, that's WACC and terminal growth rate.
Define a realistic range for each. Most practitioners sensitise within ±0.5% to 1% around the base case — enough to show meaningful variation without implausibly wide bands that destroy credibility.
For an Indian mid-market business with a base WACC of 12%, a range of 10%–14% is defensible. For terminal growth at a base of 5%, a range of 3%–7% captures the realistic spread.
With your ranges set, you have everything you need to build the table.
Step 3 — Set Up the Two-Variable Data Table
The layout maps your two variables against each other, with enterprise value populating each intersection:
- Place the enterprise value formula in the top-left corner of your table
- List WACC values across the row (left to right, low to high)
- List terminal growth rate values down the column (top to bottom, high to low)
- Use Excel's Data Table function: Alt → A → W → T
Two common errors to avoid:
- Circularity error: If you link the mid-point variable cell back to the model, you'll create a circular reference. Always hard-code the midpoint value in the input cell.
- All zeros output: If the table populates with zeros, Excel's calculation setting may be excluding data tables. Fix with Alt M X to include data tables in automatic recalculation.
Step 4 — Interpret the Output
Read the table directionally:
- Top-left cell: highest WACC + lowest growth = lowest enterprise value
- Bottom-right cell: lowest WACC + highest growth = highest enterprise value
- Midpoint cell: should match your base case DCF output exactly
If the range is extremely wide — say, 3x from low to high — that's a signal. Either the terminal growth assumptions are too aggressive at the upper end (suggesting the value driver method should be used), or the input ranges are too broad.
Once you're satisfied the output is internally consistent, the final step is confirming the logic holds and preparing the table for an audience.
Step 5 — Sanity Check and Present
Run the directional logic test:
- As discount rate rises → enterprise value falls ✓
- As growth rate rises → enterprise value rises ✓
Any deviation signals a model construction error.
For presentation, format the table with colour grading — lower values in a cooler shade, higher values in a warmer shade, with the base-case cell clearly highlighted. Investors and bankers scan these tables in seconds, not minutes. Colour grading lets them locate the base case, read the downside quickly, and assess the upside — without asking you to walk them through it.
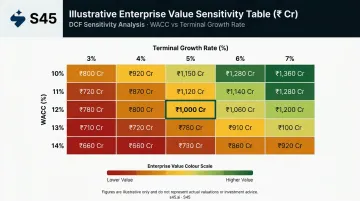
DCF Sensitivity Analysis in Practice — A Walkthrough
Consider an illustrative India-based technology business preparing for a Main Board IPO. These numbers are for demonstration only and should not be treated as sector benchmarks.
Base case setup (illustrative):
- Free cash flows growing steadily over a 5-year projection period
- Base WACC: 12% (reflecting Indian G-Sec risk-free rate, India ERP of 7.08%, and sector-specific beta)
- Terminal growth rate: 5%
- Base case enterprise value: ₹1,000 Cr
Sensitivity table output (illustrative):
| TGR: 3% | TGR: 4% | TGR: 5% | TGR: 6% | TGR: 7% | |
|---|---|---|---|---|---|
| WACC: 10% | ₹900 Cr | ₹980 Cr | ₹1,080 Cr | ₹1,200 Cr | ₹1,360 Cr |
| WACC: 11% | ₹830 Cr | ₹900 Cr | ₹990 Cr | ₹1,090 Cr | ₹1,220 Cr |
| WACC: 12% | ₹760 Cr | ₹830 Cr | ₹1,000 Cr | ₹1,090 Cr | ₹1,110 Cr |
| WACC: 13% | ₹710 Cr | ₹770 Cr | ₹840 Cr | ₹920 Cr | ₹1,020 Cr |
| WACC: 14% | ₹660 Cr | ₹710 Cr | ₹780 Cr | ₹850 Cr | ₹940 Cr |
These figures are purely illustrative. Actual enterprise values depend on your specific free cash flows, capital structure, and market conditions.
That spread — roughly ₹660 Cr to ₹1,360 Cr — is the range investors will negotiate around. The base case ₹1,000 Cr is just the starting point.
What Founders Typically Get Wrong
- Presenting only the base case ₹1,000 Cr without the table, leaving investors to assume the worst-case scenario
- Building a sensitivity table with a 4%–10% WACC range that produces an absurdly wide band and looks like cherry-picking
- Applying an 8–9% terminal growth rate without matching reinvestment assumptions, which inflates the upper-right corner artificially
A well-constructed sensitivity table tells investors something specific: that management knows why their valuation lands where it does, and has tested the edges honestly. That credibility is harder to build in a room than any single number on a slide.
How S45 Can Help
S45 is India's AI-native investment bank, built specifically for growth-stage companies preparing for Main Board and SME listings. Disciplined financial modeling — including sensitivity analysis — sits at the core of how S45 prepares companies for capital raises.
The IPO Readiness Report incorporates indicative raise range and sensitivity analysis as an early-stage deliverable, not a last-minute addition. This discipline carries through to pricing: S45's demand mapping process tracks cohort-level investor demand across QIBs, NIIs, and retail before mandate signing.
If demand signals show institutional investors clustering around the lower half of the sensitivity band, the pricing strategy reflects that reality — not a banker's optimistic midpoint.
With 26 IPOs executed, ₹1,180+ Cr raised, and 168x average subscription since July 2023, S45's valuation approach has been tested across Main Board and SME listings in sectors from industrial manufacturing to consumer technology.
Founders working with S45 don't need to be DCF experts. The sector specialists handle:
- Financial modeling and assumption stress-testing
- Sensitivity band construction tied to real investor demand signals
- Pricing strategy that holds through institutional book-building
The result is a valuation range management can defend in front of QIBs — not one that gets renegotiated at the last stage.
Conclusion
Sensitivity analysis turns a DCF from a speculative point estimate into a transparent, stress-tested valuation range. When it's built well, it tells every investor in the room that management understands its own business drivers — and has priced with rigor, not wishful thinking.
The mechanics are straightforward: a two-variable data table, WACC on one axis, terminal growth rate on the other. What's harder is building the base model correctly, choosing realistic input ranges, and having the conviction to present the full range rather than just the number that looks best.
Building the model correctly is only half the work. Sensitivity analysis is a living exercise — market conditions shift, growth assumptions age out, and the macro inputs that feed WACC (G-Sec yields, equity risk premiums) move with the economic cycle. For founders approaching a capital raise or IPO, getting this right early means arriving at pricing conversations with a defensible range, not a number you'll be forced to walk back.
Frequently Asked Questions
What is a sensitivity analysis?
Sensitivity analysis is a technique that measures how changes in one or more input assumptions affect a model's output. In finance, this means testing how shifts in variables like discount rate or terminal growth rate change a DCF's enterprise value — producing a range of outcomes rather than a single number.
What is the purpose of DCF analysis?
DCF analysis estimates the intrinsic value of a business by discounting projected future free cash flows back to the present using a risk-adjusted discount rate (WACC). It helps investors and founders assess whether a company is fairly valued relative to its expected future cash generation.
What is the formula for sensitivity analysis?
Sensitivity analysis doesn't have a single formula — it works by substituting a range of values for key inputs into the DCF formula (Enterprise Value = Σ [FCF ÷ (1 + WACC)^t] + Terminal Value) and recording each resulting output in a two-variable data table. The table itself shows how enterprise value responds across input combinations.
What are the key variables tested in a DCF sensitivity analysis?
WACC and terminal growth rate are the primary variables. For high-growth or pre-IPO businesses, revenue growth rate and EBITDA margin are worth testing as secondary inputs. In India, institutional investors frequently scrutinise revenue growth rate assumptions during due diligence.
What is the difference between sensitivity analysis and scenario analysis?
Sensitivity analysis isolates one or two variables to measure their individual impact on valuation. Scenario analysis changes a full set of assumptions simultaneously to model a specific situation — a base case, bull case, or bear case. Both are useful; they answer different questions.
How does sensitivity analysis affect IPO valuation and investor confidence?
A well-constructed sensitivity table shows institutional investors that management has stress-tested its assumptions honestly. This builds credibility during book-building, supports tighter price bands, and reduces the risk of repricing the issue or facing post-listing volatility when the valuation comes under scrutiny.