Introduction
In India's IPO market, the difference between a wildly oversubscribed offering and a withdrawn one often has less to do with the company itself than with when it showed up. Snapdeal had SEBI approval and filed its papers — then deferred its $152 million IPO indefinitely in December 2022, citing poor market conditions. boAt, Fabindia, and Joyalukkas followed. None of these were bad businesses. They were casualties of timing.
The contrast is striking when you compare it to FY2022, when Indian main board IPOs raised ₹1,11,547 crore — nearly four times the FY2021 figure — on the back of surging liquidity and investor confidence. Same exchanges, same regulatory framework, entirely different environment.
That environment is measurable. Founders who spend years building their companies often discover too late that macro conditions — not fundamentals — determine whether their listing lands or stalls. The specific economic indicators that signal whether India's IPO window is open, narrowing, or closed are knowable in advance. Reading them together is how you decide when to move.
Key Takeaways
- GDP trajectory and RBI rate direction are the two most foundational indicators for gauging investor appetite
- Nifty/Sensex trend, FII/DII flows, and recent IPO data give you real-time reads on current market receptivity
- Leading and lagging signals must be read together — no single indicator tells the full story
- Preparation must run in parallel with monitoring, because the window can open faster than most founders expect
Why Economic Timing Can Make or Break an IPO
The "IPO window" is not a fixed calendar date — it's a period when macro conditions, investor sentiment, and market liquidity align well enough for new listings to attract strong demand and fair valuations.
These windows can stay open for months. They can also close in weeks after an external shock.
The Evidence from India's IPO Cycles
India's IPO data illustrates this starkly:
| Fiscal Year | Main Board Fundraising | Context |
|---|---|---|
| FY2021 | ₹31,268 crore | Pre-boom baseline |
| FY2022 | ₹1,11,547 crore | Global liquidity surge |
| FY2023 | ₹52,116 crore | Global rate tightening — PRIME Database called it the "Fed wringer" |
| FY2024 | ₹61,860 crore (76 IPOs) | Recovery, strong retail participation |
| FY2025 (CY2025) | ₹1,85,000+ crore (101 main board + 254 SME) | Peak issuance year |
| FY2026 YTD | ₹27,000+ crore (23 companies) | Slowdown amid volatility |
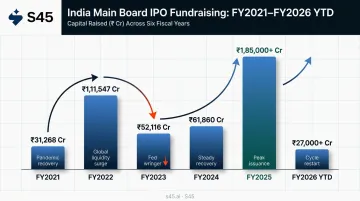
The same company, with the same fundamentals, gets a materially different valuation and subscription outcome depending on where in the cycle it lists. Market unpredictability is not the lesson here — timing is.
Economic indicators don't tell a company whether to IPO. They tell it when.
The Core Economic Indicators That Signal IPO Readiness
GDP Growth Rate
Rising GDP signals expanding corporate earnings potential and consumer demand — exactly what equity investors price into IPO valuations.
The direction of growth matters more than the absolute number. An economy accelerating from 6% to 7.8% signals momentum; one decelerating from 8% to 6.5% raises questions about the earnings outlook even if growth remains technically strong.
MoSPI reported 7.8% YoY real GDP growth in both Q3 and Q4 FY2025-26, providing a solid macro backdrop for current listings. Track quarterly GDP releases from MoSPI as a foundational confidence indicator — a necessary backdrop, not a direct timing trigger.
RBI Repo Rate and Interest Rate Cycle
Rate direction is the single most important structural driver of IPO valuation multiples.
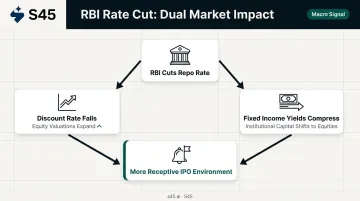
When the RBI cuts rates, two things happen simultaneously:
- The discount rate applied to future earnings falls, expanding equity valuations
- Fixed income yields compress, pushing institutional capital toward equities
The RBI cut the repo rate by 25 bps to 6.00% in April 2025, then by a further 50 bps to 5.50% in June 2025, and held at 5.25% as of June 2026. This easing cycle creates a more receptive environment for growth-stage IPO stories compared to the 2022 tightening phase, when the RBI raised rates by 40 bps in May 2022 alone and IPO fundraising fell sharply.
Track every RBI Monetary Policy Committee (MPC) statement, not just the rate decision . The stance language (accommodative, neutral, or hawkish) signals what's coming next.
Inflation (CPI)
RBI's CPI target is 4%, with a tolerance band of 2% to 6%. Within this band, inflation is manageable and unlikely to force rate hikes. Above 6%, rate hikes become probable and equity multiples compress with them.
Recent CPI readings have been comfortably inside the band:
- January 2026: 2.74%
- March 2026: 3.40%
- May 2026: 3.93%
Beyond the rate channel, high or volatile inflation erodes real consumer purchasing power, weakening the earnings outlook for consumer-facing businesses. That's the kind of narrative that makes QIB investors cautious about IPO pricing.
Equity Market Indices — Nifty 50 and BSE Sensex
Index levels and trend set the pricing psychology for every IPO in the queue.
A sustained upward trend gives promoters negotiating leverage on valuations. A correcting market forces discounted pricing or outright postponements : there's no point opening a book when institutional investors are pulling risk off the table.
Beyond direction, watch two things before pricing any issue:
- Index P/E vs. long-term averages: High P/E signals an expansion phase with growth premiums; compressed P/E signals earnings scrutiny
- Historical data source: NSE Indices provides official P/E downloads — check against 5- and 10-year averages
FII and DII Flows
Net FII inflows signal global risk-on sentiment and available capital for new issues. Net outflows are a warning signal that institutional demand for new paper will be thin.
NSDL data shows cumulative 2026 FPI net equity outflows of approximately ₹2,77,954 crore through June 25, 2026 , a significant headwind for IPO demand from the global institutional segment.
The critical counter-narrative: DII flows have become a genuine stabilising force. AMFI reported:
- March 2026 MF AUM: ₹73.73 lakh crore (up 12.2% YoY)
- Monthly SIP contribution: ₹32,087 crore
- Total MF industry AUM: ₹81.58 trillion as of May 2026
Business Standard reported DII inflows reached ₹4.3 trillion in H1 2026, acting as a buffer while FPIs exited. The structural growth of India's SIP-driven domestic investor base means IPO demand no longer lives or dies on FII participation alone. That said, heavy and sustained FII outflows still dampen appetite, particularly for large main board issues targeting QIB allocations.
Secondary Indicators Every IPO-Bound Founder Should Track
PMI (Manufacturing and Services)
India's PMI is a leading indicator — released monthly, it reflects business conditions ahead of when they show up in GDP or earnings data.
Readings above 50 signal expansion. Recent data from S&P Global/HSBC:
- Manufacturing PMI, May 2026: 55.0
- Services PMI, May 2026: 59.8
- Composite PMI, May 2026: 59.3
Sustained above-50 PMI readings across several months indicate a healthy demand environment — particularly relevant for industrial, manufacturing, and services sector IPO candidates, where investors scrutinise order book growth and capacity utilisation.
GST Collections
Monthly GST data from the Ministry of Finance is one of the cleanest proxies for formal sector economic activity in India.
- FY2024-25 gross GST collections: ₹22.08 lakh crore — up 9.4% YoY, a record
- April 2026: ₹2,42,702 crore — up 8.7% YoY
- Over 1.51 crore active GST taxpayers
For IPO investors, strong GST numbers validate two things: the scale of India's formal economy, and the addressable market claims companies make in their DRHPs. For consumer, retail, FMCG, and logistics IPO candidates, GST trend data directly supports the demand narrative.
Recent IPO Subscription and Listing Performance
The most immediate timing signal is what happened to the last 3–5 IPOs in a similar size bracket.
Heavily oversubscribed recent issues and strong listing pops tell you that retail and institutional appetite is active. Weak subscriptions or flat/negative listings signal a cautious window — even if all the macro indicators look reasonable on paper.
One important nuance: SME and main board signals can diverge significantly. SME IPOs averaged 63% listing gains in H1 FY25 versus 34.28% for main board issues in the same period. Don't read one segment's performance as a signal for the other.
To track this in real time:
- Monitor BSE's IPO Performance Tracker and NSE's new listing pages for subscription rates and listing-day returns
- Compare only within your size bracket — mainboard and SME data tell different stories
- Look at 3–5 consecutive issues, not a single outlier
That market appetite doesn't exist in isolation — it's directly shaped by currency stability and foreign capital flows.
Rupee Stability and Forex Conditions
A stable or appreciating rupee reduces risk perception among FIIs and supports equity valuations. A depreciating rupee triggers the opposite: FII risk appetite contracts, capital flows out, and market volatility rises — all unfavorable for IPO timing.
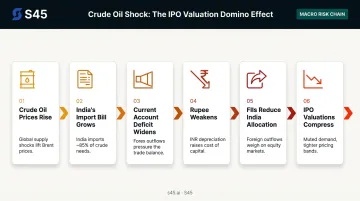
The feedback loop is direct: crude oil prices rise → India's import bill grows → current account deficit widens → rupee weakens → FIIs reduce India allocation → market indices correct → IPO valuations compress.
India imports roughly 85% of its crude oil needs, making Brent crude prices a direct upstream driver of this chain. PPAC's monthly oil and gas snapshots and NSDL's FPI flow data are practical early-warning inputs to watch alongside the rupee.
How to Read the IPO Window Using These Indicators Together
Leading vs. Lagging Signals
Not all indicators are equal in timing terms:
- Leading indicators (PMI, FII flows, market indices, RBI signals) give advance warning of changing conditions — weight these most heavily when setting a listing timeline
- Coincident indicators (recent IPO subscription data, GST collections) confirm what's happening right now
- Lagging indicators (GDP, CPI) validate trends that are already underway — useful for confirming a thesis, not for early action
The Green Zone Framework
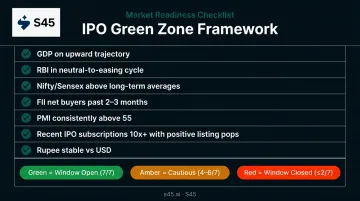
When the following conditions are present simultaneously, the IPO window is likely open:
✅ GDP on an upward trajectory ✅ RBI in a neutral-to-easing rate cycle ✅ Nifty/Sensex above long-term averages with recent gains ✅ FII net buyers over the past 2–3 months ✅ PMI consistently above 55 ✅ Recent IPO subscriptions strong (10x+) with positive listing pops ✅ Rupee stable against USD
When 3 or more of these signals flip negative, treat the window as cautious. When 5 or more flip negative, the window is likely closed.
The Risk of Waiting for Perfect Conditions
One practical caution: if every indicator is perfectly aligned, you won't be the only one watching. A fully green macro environment brings a surge of issuers to market simultaneously, increasing competition for investor attention and fragmenting demand across too many concurrent offerings.
A "7 out of 10" environment (most indicators favorable, no acute negative shock) is often the most executable window for mid-market companies. You get good conditions without fighting a crowded queue.
External Shocks Close Windows Fast
The 2022–23 cycle is the clearest India-specific illustration. Global rate tightening created what PRIME Database described as a "Fed wringer" for Indian equity fundraising — IPO volumes halved from FY2022 to FY2023, and several well-known companies shelved their plans entirely. Snapdeal, boAt, PharmEasy, Fabindia, and Joyalukkas all withdrew or deferred during this period.
That pattern has not gone away. Geopolitical uncertainty and FPI outflows have since weighed on the FY2026-27 pipeline too. A window that looks open today can close within weeks of a geopolitical escalation, a surprise Fed decision, or a domestic macro disappointment.
The Regulatory Calendar Matters Too
The Green Zone Framework is necessary but not sufficient — India's regulatory and political calendar creates its own set of predictable open and closed windows:
- SEBI's IPO approval queue — a backlog of approvals can create congestion even in good markets
- Election cycles — create predictable uncertainty windows where institutional investors reduce risk
- Union Budget timing — post-budget clarity periods often see elevated IPO activity as sectoral policy becomes clear
- RBI MPC meeting schedule — rate decisions create predictable market events that affect IPO pricing windows
Building IPO Readiness Before the Window Opens
Tracking indicators is only valuable if you're ready to act when the window opens.
In India, the full IPO journey — from DRHP filing to listing — takes 6–12 months for main board and 2–3 months for SME listings. That means by the time you observe favorable conditions, you're already too late to benefit unless preparation is already underway.
What "Ready to Move" Actually Requires
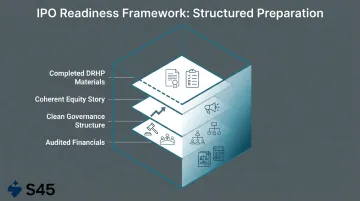
Companies that generate strong subscription numbers and listing pops are not those that timed the market perfectly from scratch. They're the ones that entered the window with:
- Three years of audited financials per Ind-AS
- Clean governance — board independence, committee structures, related-party cleanup
- A coherent equity story with a mapped investor base
- A completed DRHP, or the materials to complete one quickly
Getting those four elements in place faster than the market moves is where execution quality matters. S45's IPO readiness platform takes companies from first assessment to DRHP-ready in 30–45 days from a clean data room.
The 30-minute IPO Readiness Scan identifies governance, disclosure, and compliance gaps, then delivers a prioritised fix-list within 48 hours. Founders get a clear picture of what needs to happen before they can act on a market opportunity.
The practical takeaway: start the readiness process **12–18 months before your target listing**. Use economic indicator monitoring as a dynamic input to your timeline, not a substitute for starting. Work with advisors who read both market conditions and internal readiness simultaneously, so when indicators align, you're positioned to move within weeks, not months.
Frequently Asked Questions
Which time is best for an IPO?
The best time is when favorable macro indicators align with internal readiness: rising markets, stable or falling interest rates, net FII inflows, and strong recent IPO performance, combined with solid financials, governance, and a clear equity story. Neither macro conditions nor internal readiness alone is sufficient.
What is the time frame order of economic indicators for IPO timing?
Leading indicators (PMI, FII flows, market indices, RBI signals) come first and give early warning of changing conditions. Coincident indicators (recent IPO subscription data, GST collections) confirm what's happening now. Lagging indicators (GDP, CPI) validate the trend after the fact — weight the leading indicators most heavily when setting your listing timeline.
What is KPI in an IPO context?
In an IPO context, KPIs are the metrics investors scrutinise to assess listing worthiness: revenue growth, EBITDA margins, return on equity, cash conversion, and sector-specific operating metrics. Weak KPIs will limit a company's ability to price well, even when macro conditions are favorable.
Can we apply for an IPO after 3:30 PM?
IPO applications via UPI (ASBA) typically close at 5:00 PM on the final subscription day, though the cut-off timing can vary by broker platform. Check your specific intermediary's deadline — applying early in the day avoids last-minute technical issues.
How does RBI's interest rate policy affect IPO valuations in India?
When the RBI cuts the repo rate, it lowers the discount rate applied to future earnings, which expands equity valuations and makes growth-stage IPO stories more attractive to investors. Rate hikes do the opposite: they compress multiples and raise the pricing bar, as the 2022 tightening cycle demonstrated.
How far in advance should a company start monitoring economic indicators before planning an IPO?
Companies should begin tracking the macro environment at least 12–18 months before their intended listing. This gives enough lead time to adjust readiness timelines based on when indicators signal a favorable window approaching — and to complete the governance, financial, and compliance work that can't be rushed.