
Introduction
Every founder who has raised capital, attracted an institutional investor, or prepared for an IPO has faced one fundamental question: what is this business actually worth? The answer almost always begins with a Discounted Cash Flow (DCF) analysis.
The core logic is straightforward. A rupee you receive a year from now is worth less than a rupee you hold today — because of inflation, opportunity cost, and risk. DCF is a structured way to account for that: it converts a business's future cash flows into what they are worth right now.
This guide covers the DCF formula, how to build one step by step, a worked example using an illustrative Indian manufacturing business, and the mistakes that cause founders to walk into investor conversations with a valuation they cannot defend.
Key Takeaways
- DCF estimates a business's value by discounting expected future free cash flows to their present value using a chosen discount rate
- The three core inputs are projected free cash flows, the discount rate (typically WACC), and a terminal value
- A higher discount rate lowers the valuation; a higher growth rate raises it. Either way, the assumptions you feed the model determine the output more than the formula itself
- Terminal value can account for up to 80% of total DCF value, making the growth rate assumption especially consequential
- DCF and NPV are related but not identical: NPV adds one more step by subtracting the initial investment cost
What Is DCF Valuation?
DCF valuation estimates the present value of an investment or business based on its expected future cash flows, adjusted for the time value of money. As ICAI's Valuation Standard 103 puts it, the method "indicates fair value of a business based on cash flows expected to be generated in the future, discounted at a cost of capital reflecting business risk and capital structure."
Where DCF Gets Used
DCF applies across a wide range of financial decisions:
- Business valuation — for fundraising rounds, IPO pricing, or strategic sale
- Capital budgeting — should we build this facility or launch this product line?
- M&A due diligence — is the acquisition price justified by intrinsic value?
- Project appraisal — does this investment generate sufficient returns?
- Real estate — is the rental income stream worth the purchase price?
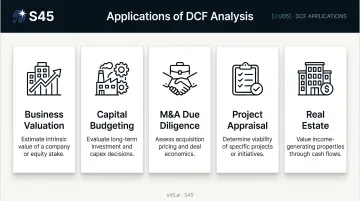
Of these, business valuation is where founders most often encounter DCF directly. A credible model is often the backbone of the valuation conversation with investors — they want to see the numbers, the assumptions behind them, and how the output shifts when those assumptions change.
Two Main Approaches
You can run a DCF on the whole firm or on equity directly:
| Approach | What You Discount | Discount Rate Used |
|---|---|---|
| Firm (enterprise) value | Free cash flows to the firm (FCFF) | WACC |
| Equity value | Free cash flows to equity (FCFE) | Cost of equity |
Cash flows and discount rates must match. Discounting equity cash flows at WACC — or firm cash flows at the cost of equity — produces a fundamentally incorrect valuation.
The DCF Formula Explained
The standard DCF formula, as articulated by Aswath Damodaran of NYU Stern, is:
DCF = CF₁/(1+r)¹ + CF₂/(1+r)² + ... + CFₙ/(1+r)ⁿ
| Variable | Definition |
|---|---|
| CF₁, CF₂ ... CFₙ | Projected free cash flow for each period |
| r | Discount rate (WACC for firm; cost of equity for equity) |
| n | Number of years in the forecast period |
Free Cash Flow: Not the Same as Net Profit
Free cash flow (FCF) is what the business actually generates after sustaining itself — after operating expenses, taxes, and the capital expenditure required to keep growing. Net profit is an accounting figure; FCF is what is genuinely available to investors.
The FCFF build, per ICAI and Damodaran:
FCFF = EBIT × (1 − tax rate) + Depreciation − Capital Expenditure − Increase in Working Capital
Start with operating profit, strip out the tax, add back the non-cash depreciation charge, then subtract real cash outflows on capex and any additional working capital the business needs to fund growth. Getting FCF right is the foundation — but it's only half the equation. What you discount those cash flows at is equally consequential.
Discount Rate and WACC
The discount rate reflects the risk an investor accepts by committing capital today for uncertain future returns. For a firm-level DCF, this is the Weighted Average Cost of Capital (WACC):
WACC = Ke × [E/(D+E)] + Kd × (1 − tax rate) × [D/(D+E)]
Where:
- Ke = cost of equity, typically derived from CAPM: Ke = Rf + β × ERP
- Kd = pre-tax cost of debt
- E, D = market value of equity and debt
- Tax rate = creates the debt tax shield
For India-specific CAPM inputs: Damodaran's January 2026 data shows India's equity risk premium at 7.02% and country risk premium at 3.40%. The FBIL benchmark 10-year GOI yield was 7.0782% as of 12 June 2026 — a reasonable risk-free rate proxy.
For startups and high-growth businesses, WACC will be higher than for established companies — the greater the uncertainty, the more steeply investors discount future cash flows. The appropriate WACC for any Indian SME must be built from its own capital structure, sector beta, size risk, and company-specific factors. No table can substitute for that work.
Terminal Value
A DCF typically forecasts cash flows for 5 to 10 years. But a business is assumed to continue operating beyond that window. Terminal value captures everything after the forecast period.
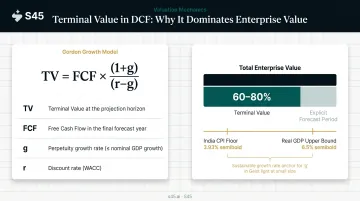
The Gordon Growth Model formula:
TV = FCF in final year × (1 + g) / (r − g)
Where g is the long-term stable growth rate.
Terminal value can account for up to 80% of the total DCF value — which makes the growth rate assumption the single most sensitive number in the entire model. Damodaran's guidance is clear: no firm can sustainably grow faster than the economy indefinitely. Anchoring terminal growth to India's CPI inflation (3.93% year-on-year as of May 2026, per MOSPI/PIB) sets a conservative floor; real GDP growth (6.5% projected for 2026, per the IMF) marks a defensible upper bound.
Once you have each year's FCF and the terminal value, divide each by (1 + r)^t to convert it to today's money. The further out a cash flow, the smaller that discount factor becomes. Sum everything, and you have your present value.
How to Perform a DCF Valuation: Step by Step
The formula is mechanical. The quality of the DCF is not — it depends entirely on the quality of the inputs. Most errors come from skipping validation, using unrealistic growth assumptions, or mismatching cash flows with discount rates.
Step 1 – Build Financial Projections
Start with a rigorous financial model projecting revenue, costs, margins, capital expenditure, and working capital needs for the next 5 to 10 years.
These projections must be grounded in operating reality:
- Industry benchmarks and historical growth rates
- Confirmed order books or contracted revenue where available
- Realistic margin assumptions supported by actual cost structures
- Capex schedules tied to specific expansion plans, not vague growth targets
The quality of projections is what separates a credible valuation from a speculative one. When preparing for a fundraise or IPO, investors and bankers will probe every assumption.
"We expect 40% revenue growth" is not a projection. "We expect 40% revenue growth based on three signed offtake agreements and confirmed capacity expansion" is.
Step 2 – Calculate Free Cash Flows
Derive FCF from your projections using the FCFF build: EBIT → apply tax → add back depreciation → subtract capex → adjust for working capital changes.
FCF is a better valuation input than net profit: it captures cash the business generates after sustaining and growing itself, not accounting-adjusted earnings distorted by depreciation policies or non-cash items.
Step 3 – Determine the Discount Rate
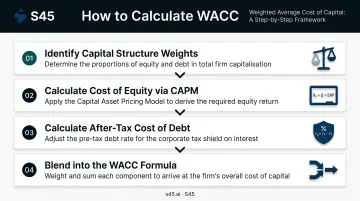
To estimate WACC:
- Identify the market value of equity and debt (your capital structure weights)
- Calculate cost of equity via CAPM: risk-free rate + beta × equity risk premium
- Calculate after-tax cost of debt: pre-tax debt rate × (1 − tax rate)
- Blend the two using the WACC formula, weighted by each component's share of total capital
India's standard corporate tax rate for domestic companies is 22% (as announced in the 2019 tax reform, per PIB). For new domestic manufacturing companies, the rate is 15%.
For growth-stage or SME businesses, WACC will be materially higher than for established listed companies, reflecting the greater uncertainty of cash flow forecasts, limited operating history, smaller scale, and higher execution risk. Do not borrow a WACC from a comparable listed peer without adding a meaningful company-specific risk premium.
Step 4 – Calculate Terminal Value and Discount Everything
Apply the Gordon Growth Model using the final year's FCF and a conservative long-term growth rate. Then discount every annual FCF and the terminal value back to today using the discount factor: 1/(1 + r)^t.
Terminal value typically accounts for 60–80% of the total DCF output, which means overly optimistic terminal growth assumptions are the single most common source of overvaluation in founder-prepared models. If your terminal growth rate exceeds what the Indian economy can sustainably deliver, you will need to defend that assumption in front of sophisticated investors — and it rarely holds up.
Step 5 – Sum and Interpret
Add the discounted annual FCFs (years 1 through n) plus the discounted terminal value. The result is your estimated enterprise or equity value.
Then run scenarios:
| Scenario | WACC | Terminal Growth | Implied Value |
|---|---|---|---|
| Base case | Chosen rate | Inflation-anchored | Central estimate |
| Downside | +2% | −1% | Stress-tested floor |
| Upside | −1% | +0.5% | Optimistic ceiling |
A 1% shift in either WACC or terminal growth can move the implied value by 15–25% in a typical model. Running this table before any investor conversation tells you where your valuation is fragile — and where it holds.
DCF Valuation in Practice: A Worked Example
This is an illustrative walkthrough using a fictional Indian manufacturing business. It is not a real company or a financial recommendation.
Setup: Arjun Fabrications Private Limited — a mid-sized industrial components manufacturer with ₹100 crore in annual revenue, preparing to raise growth capital. The model uses the following assumptions:
- Revenue growth: 15% annually
- EBIT margin: 18% (stable across the projection period)
- FCF: ~60% of EBIT after tax (net of depreciation, capex, and working capital)
- WACC: 16%
- Terminal growth rate: 5% (conservative; inflation-plus anchor)
- Tax rate: 22%
Year-by-Year FCF and Present Value
| Year | Revenue (₹ Cr) | FCF (₹ Cr) | Discount Factor (16%) | PV of FCF (₹ Cr) |
|---|---|---|---|---|
| 1 | 115.0 | 11.2 | 0.862 | 9.6 |
| 2 | 132.3 | 12.9 | 0.743 | 9.6 |
| 3 | 152.1 | 14.8 | 0.641 | 9.5 |
| 4 | 174.9 | 17.0 | 0.552 | 9.4 |
| 5 | 201.2 | 19.6 | 0.476 | 9.3 |
| Sum of PV (Years 1–5) | 47.4 |
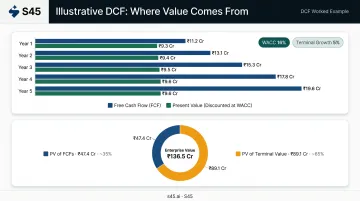
Terminal Value: FCF in Year 5 × (1 + 0.05) / (0.16 − 0.05) = 19.6 × 1.05 / 0.11 = ₹187.1 Cr
PV of Terminal Value: 187.1 × 0.476 = ₹89.1 Cr
Estimated Enterprise Value: ₹47.4 + ₹89.1 = ₹136.5 Cr
The terminal value accounts for roughly 65% of total enterprise value — even at a conservative 5% growth rate. That concentration is what makes terminal assumptions the single most contested number in any DCF conversation with investors.
What Changes When Assumptions Shift
| Change | Impact |
|---|---|
| WACC rises to 18% | Enterprise value falls to approximately ₹110 Cr |
| Terminal growth drops to 4% | Enterprise value falls to approximately ₹122 Cr |
| Both together | Enterprise value falls to approximately ₹97 Cr |
If investors perceive more risk — or simply disagree with your long-term growth story — they discount the future more steeply. That disagreement shows up immediately as a lower valuation today.
Common Mistakes This Example Illustrates
- Projecting aggressive FCF growth without capex discipline — growth costs money; the model must reflect the capex required to achieve it
- Using a WACC that is too low — an early-stage or SME business is not priced at the same risk as a listed blue-chip
- Front-loading value in terminal assumptions — stress-test the terminal growth rate before presenting to investors, not after
How S45 Can Help
For founders preparing to access public markets, valuation shapes every conversation with investors, bankers, and regulators. Get it wrong, and no pitch deck recovers the ground lost.
S45 is India's first AI-native investment bank, built specifically to help growth-stage Indian businesses go public on the Main Board (NSE, BSE) and SME exchanges (NSE Emerge, BSE SME). Valuation sits at the heart of what S45 does: from initial IPO readiness assessments through to pricing, bookbuilding, and post-listing investor relations.
In practice, this means:
- Indicative pricing bands benchmarked against Indian and global comparables
- Sensitivity analysis across sector-specific variables
- DRHP-ready documentation built for SEBI scrutiny
- Valuations that hold up under the first probing question from an anchor investor
S45's process moves from first call to signed mandate in 7 days and to a DRHP-ready draft in 30 days from a clean data room. The 0% upfront fee model means milestone-linked alignment from day one.
If you want clarity on your company's valuation and the path to public markets, start with an IPO Readiness Scan or speak directly with a banker at s45.ai.
Frequently Asked Questions
Is DCF valuation the same as NPV?
DCF calculates the present value of future cash flows. NPV takes that result and subtracts the upfront cost of the investment to determine net value created. NPV adds one final step to the DCF process. It is not a different method, just a more complete one.
What is WACC and how is it used in a DCF?
WACC is the blended cost of a company's debt and equity financing, weighted by their proportions in the capital structure. In a DCF, WACC serves as the discount rate that converts future cash flows into today's value : a higher WACC signals higher perceived risk and produces a lower present value.
What are the key components of a DCF valuation?
Three inputs drive every DCF: projected free cash flows over the forecast period, the discount rate (usually WACC), and terminal value, which captures business worth beyond the explicit forecast window. Errors in any one of these three will skew the entire valuation.
What is terminal value in a DCF?
Terminal value estimates the worth of a business beyond the forecast period, assuming stable long-term growth. It is typically calculated using the Gordon Growth Model, then discounted back to today. Because terminal value often represents the majority of total DCF value, the assumed growth rate is the single most consequential input in the model.
What are the main limitations of DCF valuation?
DCF is highly sensitive to input assumptions: small changes in the discount rate or long-term growth rate produce very different valuations. It also depends on the accuracy of financial forecasts, which are inherently uncertain. DCF is most reliable for businesses with stable, predictable cash flows and less reliable for early-stage or cyclical companies.
When is DCF most useful for founders?
DCF is most useful when a founder needs to establish an intrinsic, fundamentals-based value before raising institutional capital, preparing for an IPO, or negotiating with a strategic acquirer. It is especially useful when comparable transactions are scarce or when future growth prospects diverge sharply from current financial performance.